EX16 — Integrated Constellation Study
Tags: integrated study · coverage · communications · attitude · power
Input: integrated-constellation-study.yaml · Runtime tier: extended · Recommended views: 2D, 3D, Power, Analysis
Purpose
This case study asks a coupled engineering question: how well does a compact LEO constellation turn geometric opportunity into routed regional service, and can the spacecraft power system sustain that activity?
It uses the packaged integrated-constellation-study.yaml example from input to
interpreted result. The purpose is to show how several Astraeus models answer
one system question together. Field-level definitions remain in the
RunSpec, geometry,
communications, power,
and artifact references.
Setup
The RunSpec represents a deliberately compact service architecture:
| Choice | Configured value | Engineering role |
|---|---|---|
| Constellation | 48 satellites in 6 planes | Provides a meaningful regional service geometry without showcase-scale runtime |
| Orbit | 550 km circular, 53° inclination | LEO baseline spanning both selected latitude bands |
| Simulation | 24 hours at 300-second reporting cadence | Captures a daily demand cycle and repeated access opportunities |
| Service regions | Europe and Southeast Asia | Exposes different coverage and gateway geometry from one architecture |
| Ground segment | Madrid, Cairo, and Singapore | Supplies explicit gateways for routed service |
| Demand | Consumer and low-rate IoT cohorts | Produces region- and local-time-dependent offered traffic |
| Transport | Gateway-required, greedy-capacity scheduling | Counts service only when the complete user-satellite-gateway chain closes |
| Spacecraft | Nadir/Sun attitude and activity-coupled power | Connects communications activity to the electrical timeline |
The 5° regional grids and five-minute reporting cadence are deliberate study resolutions. The outputs therefore describe this sampled scenario; they do not replace a convergence study for shorter events or finer geographic gradients.
Run The Packaged Case
Copy the installed resources once:
astraeus resources copy astraeus-resources
Run the example with strict stage handling:
astraeus run \
  astraeus-resources/examples/user/integrated-constellation-study.yaml \
  --run-id integrated-constellation-case-study \
  --strict
The bundle is written to
runs/core/integrated-constellation-case-study/. In a second terminal, the
Run Monitor can follow the stage sequence while it runs:
astraeus monitor serve --runs-root runs
The case normally completes in about 10 seconds, used about 324 MiB peak RSS in
the reference execution, and wrote a 49 MiB run bundle. Runtime varies by
platform. The resulting run_manifest.json records the software version,
revision, input hash, seed, warnings, and status of every resolved stage.
RunSpec Focus
The RunSpec requests coverage, attitude, transport, and power. Astraeus resolves the dependencies required to make those outputs meaningful:
All nine internal modules completed. Transport was the dominant calculation at 6.78 seconds; the other modules each completed in about 1.1 seconds or less. Treat that timing as diagnostic evidence for this specific configuration and execution environment.
The distinctive RunSpec choice is to request the system-level outputs together; Astraeus resolves the intermediate dependencies shown above.
execution:
  stages: [coverage, attitude, transport, power]
mission:
  service:
    population:
      cohorts:
        presets: [consumer_indoor, iot_low_rate]
transport:
  scheduler:
    path_mode: gateway_required
power:
  activity_coupling_enabled: true
Artifacts To Inspect
Generate the deterministic review and the plot-backed scenario report:
astraeus review run \
  --run-dir runs/core/integrated-constellation-case-study \
  --output runs/core/integrated-constellation-case-study/run-review.md

astraeus report scenario \
  --run-dir runs/core/integrated-constellation-case-study \
  --output runs/core/integrated-constellation-case-study/scenario-report.md
Use these artifact families to trace the result:
| Question | Primary evidence |
|---|---|
| What exactly ran? | run_manifest.json, runspec.json, environment_summary.json |
| What constellation was resolved? | config/resolved_constellation_layout.json, states/ |
| How much geometric opportunity exists? | coverage/coverage_summary.json, area and point Parquet summaries |
| Where does service close? | mission/service_summary.json, transport/kpi_scheduler_global.json |
| Was delivered traffic link- or scheduler-limited? | transport/transport_summary.json, point and gateway KPI tables |
| What activity reached the spacecraft model? | activity/activity_summary.json, activity/activity_timeline.parquet |
| Did the electrical system remain feasible? | power/power_summary.json, power/timeline_power.parquet |
The Console provides the spatial and timeline views for the same saved evidence:
astraeus console --runs-root runs
Results
Geometry And Coverage
The 48 satellites produce 725 sampled gateway contact windows across the three sites. A satellite sees 15.1 contacts on average, with a 10-minute median sampled contact duration.
Across the 82 coverage cells, the equal-point mean coverage is 36.07%; the represented-area-weighted mean is 33.83%. The distinction matters because the latitude-longitude cells represent different surface areas. Europe reaches 46.33% area-weighted coverage, while Southeast Asia reaches 25.73%.
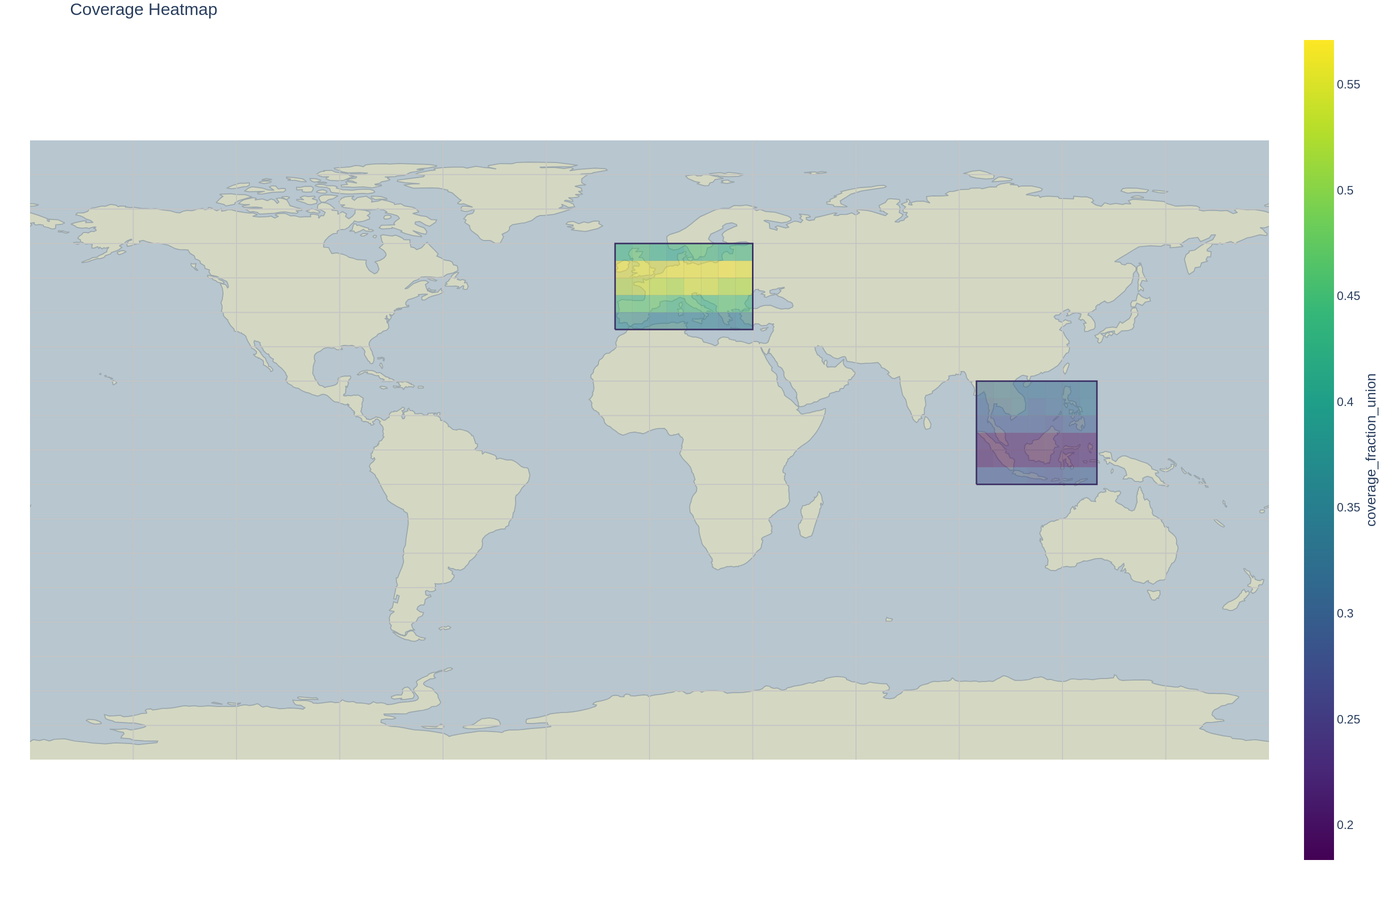
The global pointwise p95 coverage gap is 2.42 hours and the maximum is 2.67 hours. The architecture therefore provides recurring opportunity, but it does not provide continuous regional coverage at this scale and elevation mask.
From Opportunity To Delivered Service
The service model creates 47,396 user-time transport items across 164 cohort execution points. The sampled user-link opportunity fraction is 23.10%, while complete gateway-routed service is available for 2.35% of point-time samples.
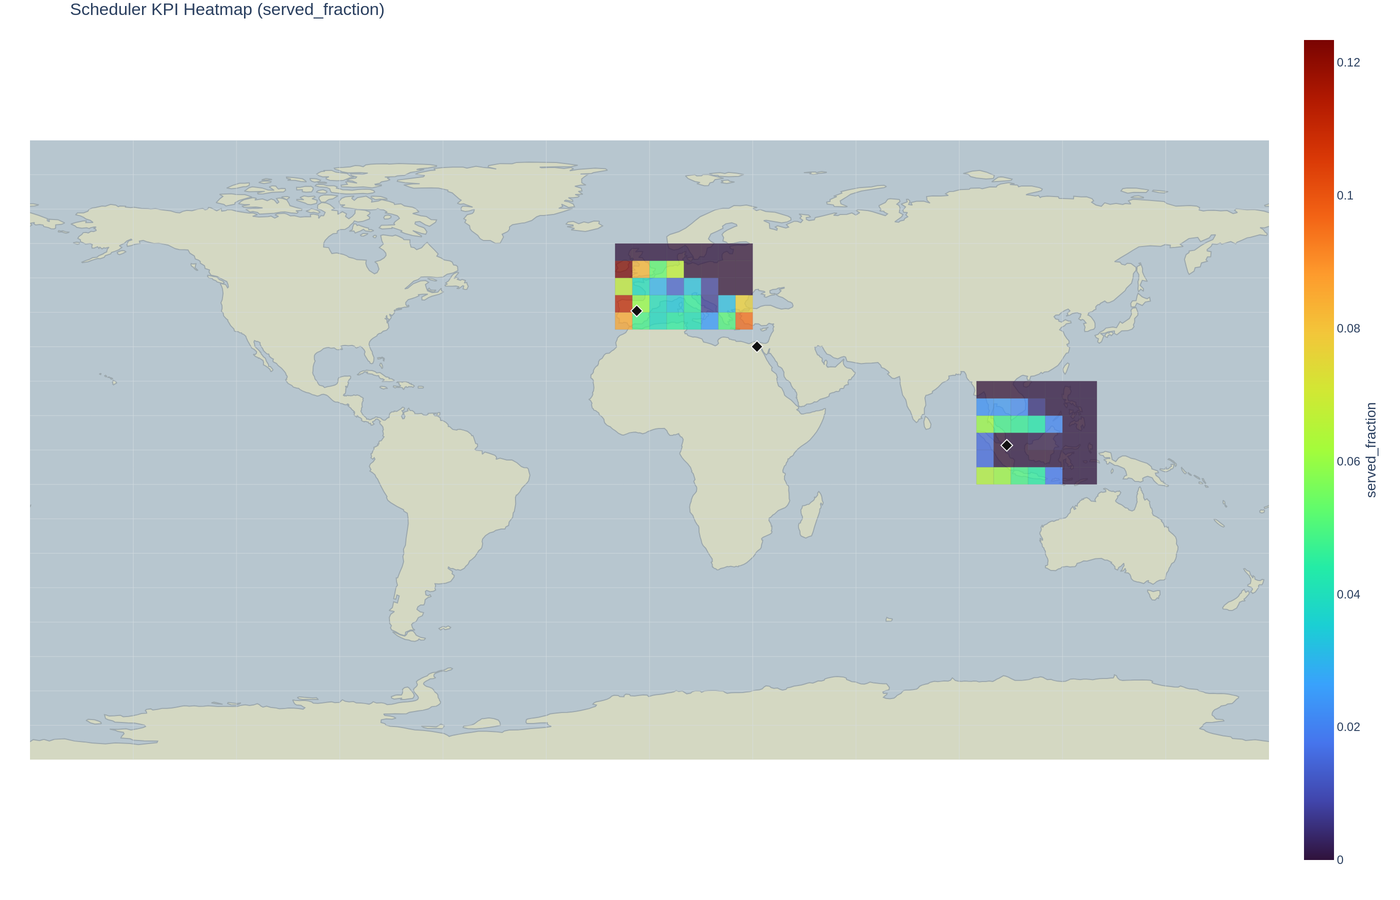
The transport ledger makes the reduction inspectable:
| KPI | Result |
|---|---|
| Generated and admitted traffic | 8.877 GB |
| Delivered traffic | 4.363 GB |
| Delivery success by bytes | 49.15% |
| End-of-run expired backlog | 4.514 GB |
| Served path samples | 1,112 |
| Served one-way latency p95 | 41.57 ms |
| Unscheduled point-time samples: no closed candidate | 41,380 |
| Unscheduled point-time samples: beam-flow cap | 4,904 |
Most unscheduled samples lack a complete user-satellite-gateway candidate. The configured per-beam flow limit is the secondary denial mode. For paths that do close, the RF margins remain positive on the emitted reachable samples:
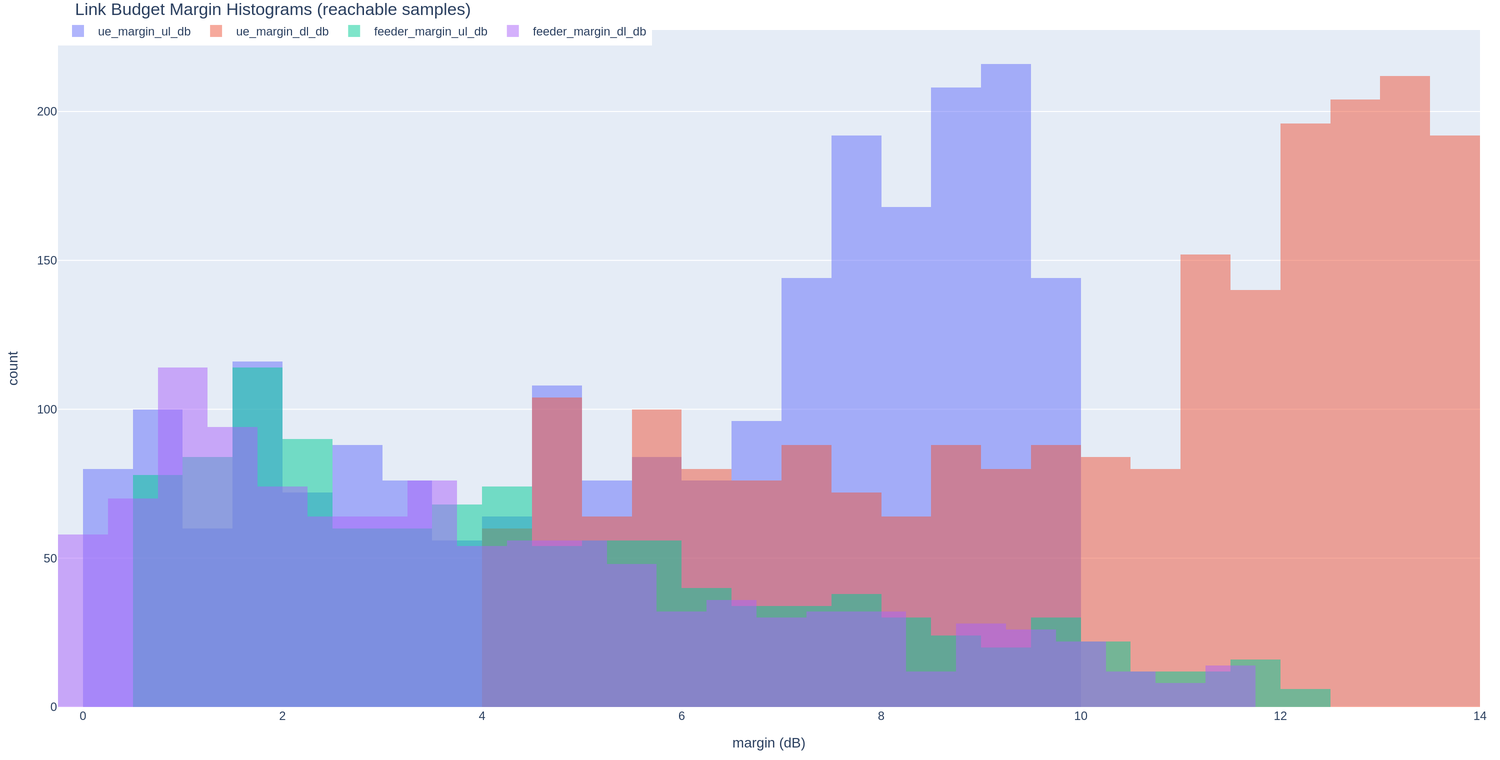
| Link leg | Median margin |
|---|---|
| User uplink | 6.78 dB |
| User downlink | 10.89 dB |
| Feeder uplink | 4.02 dB |
| Feeder downlink | 3.42 dB |
These values point first toward spatial persistence, gateway geometry, and scheduler concurrency—not additional RF headroom—as the most useful next trades for this particular configuration.
Spacecraft State
The attitude timeline completes with zero constraint violations and nadir as the dominant resolved mode. Communications activity is passed into the power model: the fleet state of charge remains between 53.72% and 88.31%, with no energy deficit or low-state-of-charge violation events. Power is therefore not the binding constraint in this 24-hour run.
Power Sensitivity Trade
The packaged resources include a supporting two-case batch that keeps the constellation, service network, traffic, scheduler, attitude, and spacecraft configuration fixed. It changes only the electrical load assigned to each active communications beam:
power:
  payload:
    coupling:
      active_beam_w: 12  # compared with 30 W in the second case
Run the comparison from the same copied resource tree:
astraeus batch run \
  astraeus-resources/examples/user/studies/integrated-service-power-trade.yaml \
  --batch-id integrated-service-power-trade
Both cases deliver the same 4.363 GB of traffic because the communications architecture is unchanged. The higher active-beam load instead narrows the spacecraft energy margin:
| Result | 12 W per active beam | 30 W per active beam |
|---|---|---|
| Delivery success | 49.15% | 49.15% |
| Fleet mean total load | 2.080 kW | 2.119 kW |
| Orbit energy margin, p5 | 1.67% | -0.05% |
| Orbit energy margin, p50 | 25.54% | 24.77% |
| Fleet minimum state of charge | 53.72% | 53.55% |
The median orbit remains comfortable, but the lower tail crosses zero in the high-draw case. This is a useful warning that fleet-average state of charge can look healthy while a small set of spacecraft-orbit combinations consume more energy than they generate.
The grouped evidence is in batch_summary.json and batch_summary.csv; each
child bundle retains power/power_summary.json, power/timeline_power.parquet,
and the complete service and transport artifacts.
AI-Assisted Comparison
The bundled skills can turn the packaged comparison into an editable study:
$astraeus-runspec-drafter Starting from the EX16 power-trade cases, create a
third case with 24 W per active beam. Keep every other resolved assumption
fixed, validate it, and show me the controlled difference.

$astraeus-study-manager Add the 24 W case to a copy of the EX16 power batch,
plan the study, summarize its cases and preflight, and stop for approval before
running.

$astraeus-study-reporter Compare delivery, fleet load, minimum state of charge,
and p5/p50 orbit energy margin across the completed cases. Cite the grouped and
child-run artifacts behind each conclusion.
The assistant helps author, operate, and interpret the trade. Astraeus remains the source of validation, execution, and saved engineering evidence.
Interpretation
The case separates three statements that are easy to conflate:
- Configured assumption: a 48-satellite, three-gateway architecture with a gateway-required real-time path and bounded per-beam concurrency.
- Calculated evidence: 33.83% area-weighted geometric coverage, 2.35% routed service availability, 49.15% byte delivery, positive served-path link margins, and a feasible power timeline.
- Interpretation: end-to-end availability is driven primarily by closed-path opportunity, with beam-flow concurrency second; RF margin and power are not the first constraints to change.
A disciplined follow-on study would vary one lever at a time: gateway count and placement, constellation density or inclination, elevation masks, and beam-flow parallelism. Use a sweep or explicit batch to keep those cases comparable. The geometry, communications, and power guides describe the assumptions behind each model, while Understanding Outputs explains how to preserve and compare the resulting evidence.