EX15 — Population Service
Tags: population demand · service cohorts · regional traffic
Input: population-service.yaml · Runtime tier: standard · Recommended views: 2D, Analysis
Purpose
Turn population distribution, terminal cohorts, and local-time behavior into regional offered traffic, then evaluate how much is delivered.
Setup
Forty-eight satellites serve Europe, North Africa, and Southeast Asia through three gateways for 24 hours. Three user-equipment cohorts create spatially and temporally differentiated demand.
astraeus run astraeus-resources/examples/user/population-service.yaml
RunSpec Focus
The population block controls eligibility, cohort shares, terminal profiles, and local-time demand. It replaces a uniform per-grid-point offered load with a resolved service population.
mission:
  service:
    population:
      eligibility:
        area_ids: [europe, north-africa, southeast-asia]
      cohorts:
        presets: [consumer_indoor, consumer_outdoor, rural_offgrid]
      temporal:
        local_time_mode: solar_longitude
Results
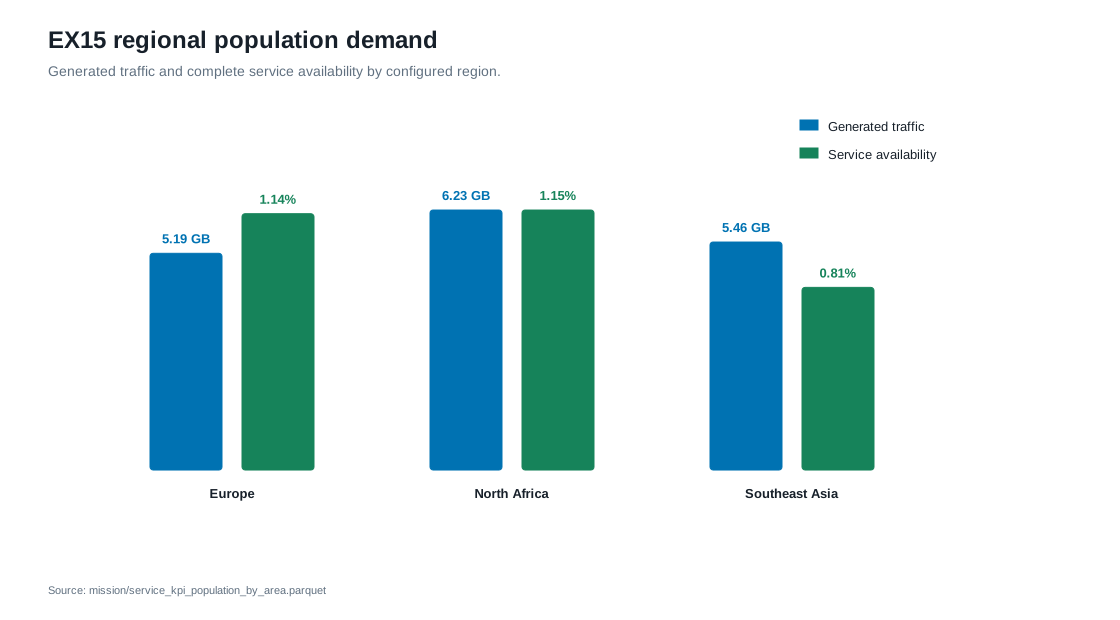
The reference run completed successfully in 15.85 seconds. It resolved 130 eligible cells, three enabled cohorts, and 390 cohort execution points, generating 16.882 GB. Transport delivered 5.641 GB (33.42%). User-link opportunity covered 10.02% of point-time samples; complete service covered 1.22%.
Artifacts To Inspect
| Artifact | What it shows |
|---|---|
mission/service_population_summary.json |
Population resolution, cohort counts, demand totals, and profile provenance |
mission/service_kpi_population_by_area.parquet |
Demand, opportunity, and complete service resolved by region |
mission/service_kpi_population_points.parquet |
Population and service KPIs at every execution point |
transport/transport_summary.json |
End-to-end delivery, capacity, backlog, and scheduler outcomes |
Interpretation
The demand model explains where and when traffic is offered; the transport model explains whether a complete path serves it. The gap between opportunity and service again makes end-to-end geometry the first constraint to investigate, while cohort and regional artifacts show who is affected.