Run Monitor
The monitor provides read-only operational visibility into core runs, sweeps, and batches by scanning their saved state and logs. Run control remains with the CLI and operating-system process tools.
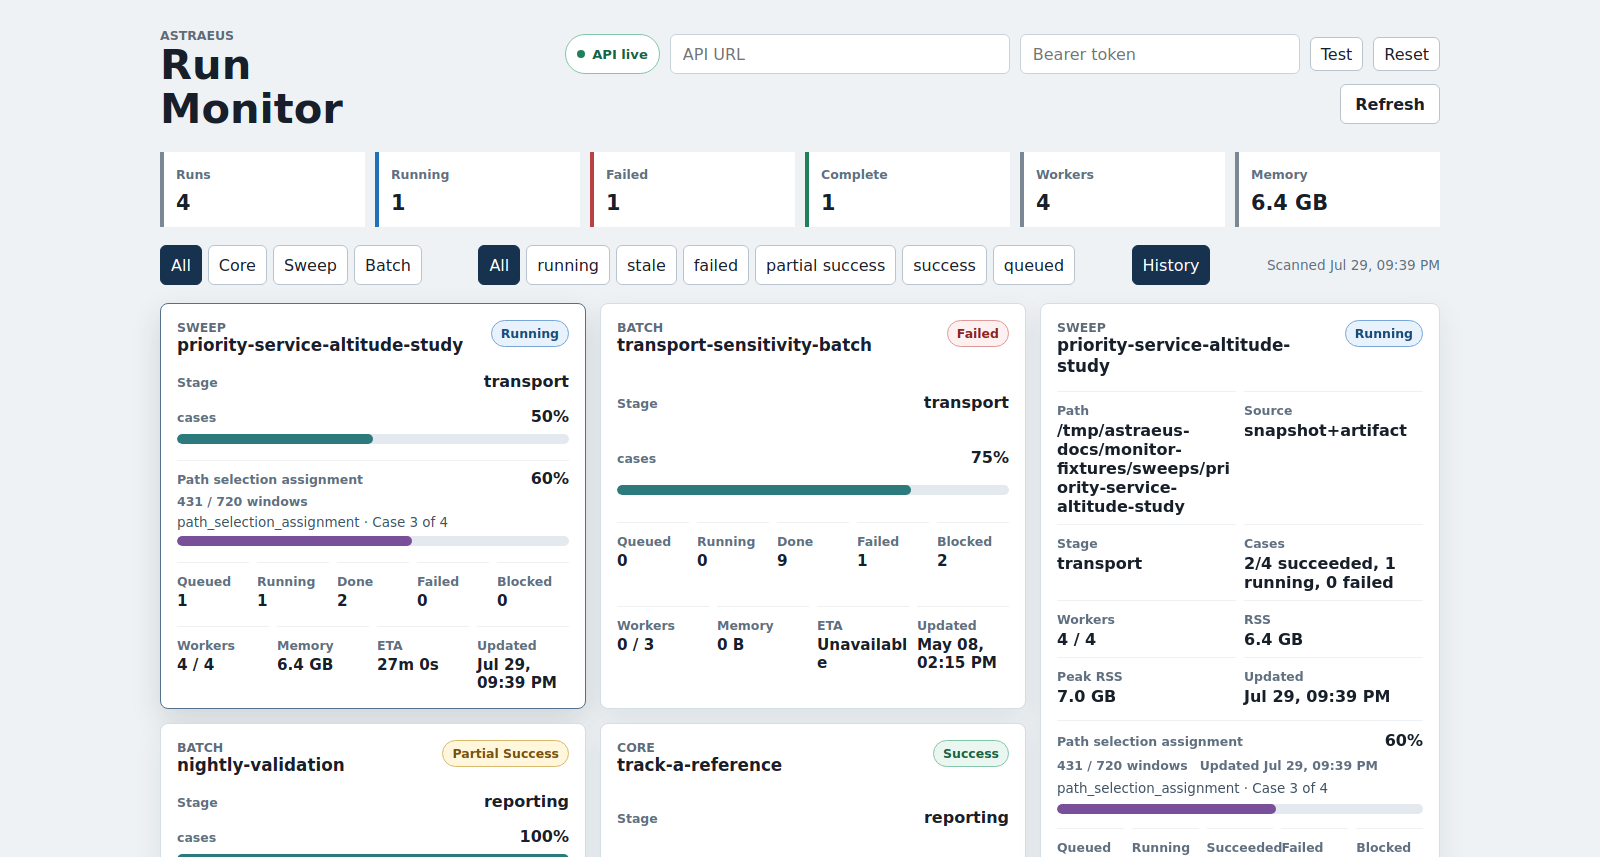
Use the summary counters for portfolio health, select a run for details, and expand grouped cases when a sweep or batch needs closer inspection.
Start The Run Monitor
For local use:
astraeus monitor serve --runs-root runs
Open http://127.0.0.1:8780. The installed command serves both the dashboard
and its read-only API.
--runs-root must point to the directory containing the core, sweeps, and
batches trees. Runs appear automatically as their saved state changes.
What It Reports
Depending on the run and stage instrumentation, records can include:
- current status and stage
- overall and stage progress
- start, update, and completion times
- active workers and processes
- current and peak memory
- warnings and artifact location
- bounded log tails
- grouped child-case counts and individual child status
Not every stage reports numeric inner progress. Stage identity, heartbeat, memory, timestamps, and logs still provide evidence that a long calculation is advancing.
Status Interpretation
| Status | Meaning |
|---|---|
| Queued or planned | Waiting for execution. |
| Running | The owning process is updating monitor state. |
| Success | Execution completed successfully. |
| Partial success | Grouped execution completed with mixed outcomes. |
| Failed | Execution terminated unsuccessfully. |
| Stale | A running record has not refreshed within the configured window. |
Stale reports an elapsed update window. Confirm the operating-system process and run log before deciding that work has stopped.
API Access
The dashboard uses the same-origin API. It is also available for approved local integrations:
| Endpoint | Purpose |
|---|---|
GET /monitor/runs |
List visible run records. |
GET /monitor/runs/{kind}/{run_id} |
Read one record. |
GET /monitor/runs/{kind}/{run_id}/log |
Read a bounded log tail. |
GET /monitor/runs/{kind}/{run_id}/children |
Page through sweep or batch children. |
GET /monitor/runs/{kind}/{run_id}/children/{case_id} |
Read one grouped child. |
GET /health confirms that the service is running.
List queries support history and hidden records. Hide and restore operations
change only monitor visibility metadata under runs/.monitor/; the run bundle
remains unchanged.
Remote Access
Non-loopback binds require bearer-token protection unless the explicit unsafe override is used. Put the token in an environment variable:
ASTRAEUS_MONITOR_TOKEN=<secret>
astraeus monitor serve --runs-root runs --host 0.0.0.0 --port 8780
Send it as Authorization: Bearer <secret>. --token-env selects a differently
named variable. Use --cors-origin for each exact browser origin when a separate
approved client needs cross-origin access.
Run metadata can expose identifiers, filesystem paths, timing, warnings, logs, and resource usage. Keep the service on loopback, an SSH tunnel, a private network or VPN, or behind an authenticated HTTPS proxy.
Timing Controls
| Variable | Default | Purpose |
|---|---|---|
ASTRAEUS_MONITOR_HEARTBEAT_INTERVAL_S |
10 |
Active-run state refresh interval. |
ASTRAEUS_MONITOR_STALE_AFTER_S |
300 |
Inactivity before a running record is marked stale. |
ASTRAEUS_MONITOR_RETENTION_AFTER_S |
43200 |
Age before inactive records move behind history. |
Use off for heartbeat, stale, or retention behavior that should be disabled.
Optional Notifications
The monitor can send best-effort alerts when it first observes a run as
running, success, failed, partial success, or stale. Enable the
monitor producer explicitly and configure the same ASTRAEUS_NOTIFY_* backend
used by command notifications:
ASTRAEUS_MONITOR_NOTIFICATIONS=true
ASTRAEUS_NOTIFY_NTFY_URL=https://<server>/<topic>
astraeus monitor serve --runs-root runs
running maps to the backend's started filter, while failed, partial
success, and stale map to failure. This keeps
ASTRAEUS_NOTIFY_ON=started,success,failure compatible with command lifecycle
notifications while the alert title retains the monitor's exact observed
status.
Each run/status pair is sent once during a monitor process. Restarting the
monitor resets that in-memory history and can repeat the current observed
status. To avoid receiving both command-generated and monitor-observed alerts,
configure ASTRAEUS_NOTIFY_* only in the process that should own notification
delivery. Monitor delivery failures do not affect scans or run state.
Troubleshooting
- If no runs appear, verify the runs root and request history or hidden records.
- If a live run appears stale, compare its heartbeat interval, log, and process state with the stale threshold.
- If grouped children are missing, confirm the sweep or batch bundle has current plan/result artifacts.
- If remote access returns
401, confirm the bearer token and selected token environment variable. - If a browser client is blocked, use an exact CORS origin and avoid mixed HTTP and HTTPS content.
- If notifications do not arrive, confirm both
ASTRAEUS_MONITOR_NOTIFICATIONS=trueand anASTRAEUS_NOTIFY_*backend are present in the monitor service environment.