EX21 — Power Array Architecture Trade
Tags: power · solar arrays · SADA · controlled comparison
Input: power-array-architecture-trade.yaml · Runtime tier: standard · Recommended views: 3D, Power, Analysis
Purpose
Compare how panel mounting and tracking change generation and battery margin on the same nadir-pointing spacecraft. The study isolates array architecture rather than mixing it with a battery or load-sizing trade.
Setup
The batch runs three 12-hour, single-satellite cases. Orbit, attitude, fixed 45 W spacecraft load, 800 Wh battery, 0.8 m² collecting area, electrical efficiency, initial state, and 60-second cadence are identical.
The Console example picker loads the SADA deployed-wing case as the most complete single-run representative. Run the batch from the command line to produce and compare all three architectures:
astraeus batch run \
  astraeus-resources/examples/user/power-array-architecture-trade.yaml \
  --workers 1
The cases compare panels on opposing body faces, deployed wings with a fixed panel normal, and deployed wings with ±90° single-axis SADA tracking.
RunSpec Focus
Each child imports one shared baseline and supplies only its panel geometry. The SADA case adds the drive envelope to the same deployed-wing mounting geometry:
power:
  panels:
  - kind: deployed_sada
    area_m2: 0.4
    mount_face_body: [1.0, 0.0, 0.0]
    panel_normal_body: [0.0, 0.0, 1.0]
    drive:
      axis_body: [1.0, 0.0, 0.0]
      min_angle_deg: -90
      max_angle_deg: 90
      max_slew_deg_s: 2
Results
All three reference cases completed successfully. The body-mounted and SADA architectures remained above 58% state of charge and retained positive median orbit-energy margins. The fixed deployed normal was poorly aligned with the Sun under the chosen nadir attitude; its battery reached 0% during the 12-hour run.
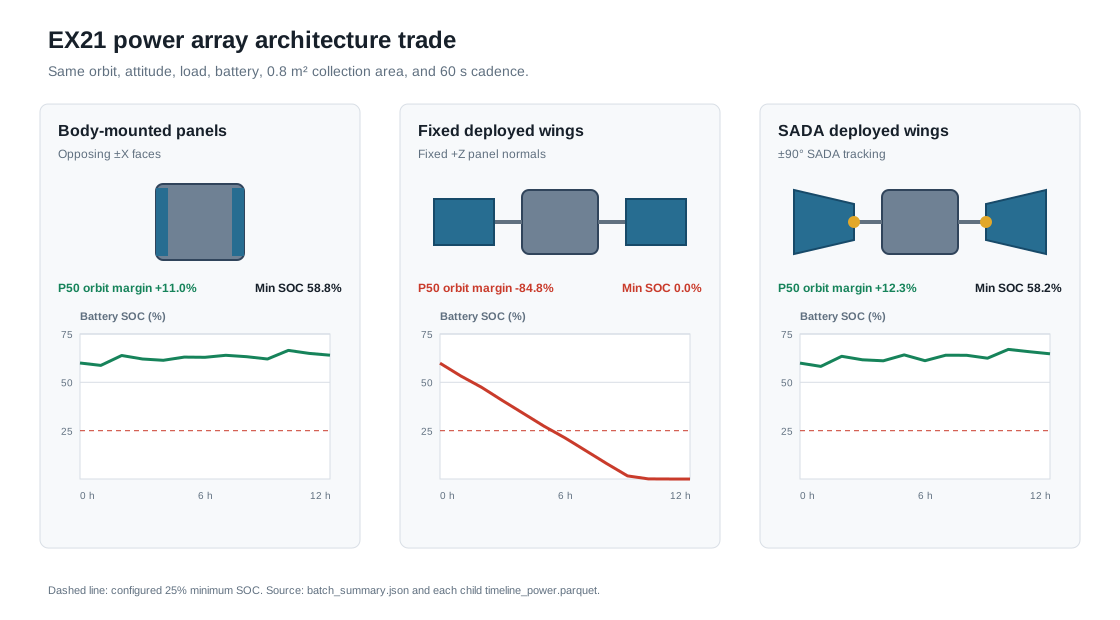
| Architecture | Minimum SOC | Median orbit-energy margin | Interpretation |
|---|---|---|---|
| Body-mounted panels | 58.8% | +11.0% | The opposing body faces provide sufficient collection for this attitude and load. |
| Fixed deployed wings | 0.0% | −84.8% | More visible structure does not help when its fixed normal is poorly aligned. |
| SADA deployed wings | 58.2% | +12.3% | Tracking closes the energy cycle with modest additional margin in this case. |
Artifacts To Inspect
| Artifact | What it shows |
|---|---|
batch_summary.json and batch_summary.csv |
Comparable SOC and orbit-margin fields across the three architectures |
cases/<case>/attempts/<attempt>/power/power_summary.json |
Energy, margin, and SOC rollups for one architecture |
cases/<case>/attempts/<attempt>/power/timeline_power.parquet |
Generation, load, eclipse state, net power, and battery SOC over time |
cases/<case>/attempts/<attempt>/power/power_panel_angles.parquet |
Commanded and applied panel angles, including SADA motion |
Child run_manifest.json and state artifacts |
Complete evidence bundle for opening the child run in the Console |
Interpretation
Array area alone does not determine the power result. Mounting geometry must be evaluated with the spacecraft attitude, and a drive only adds value where its axis and travel can improve Sun incidence. Use the child bundles to inspect the three spacecraft in 3D and confirm that the electrical result follows the modeled geometry before changing area, efficiency, storage, or load.